
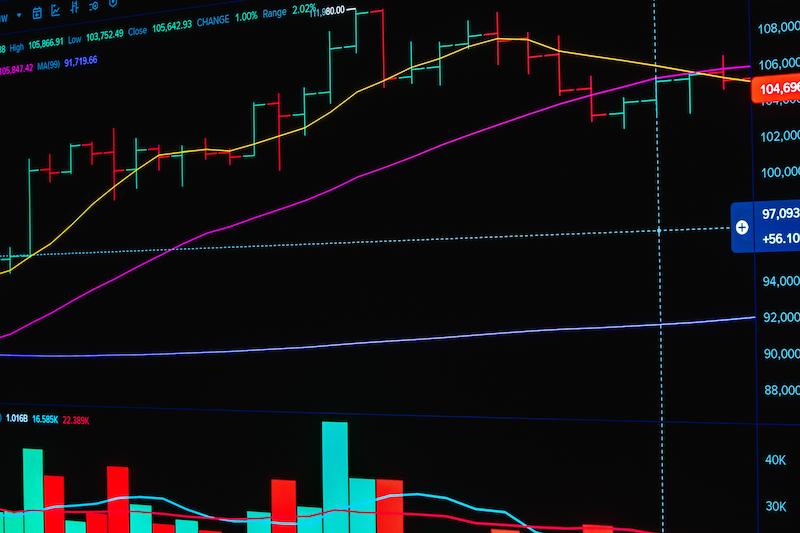
Charts fascinate market participants because they appear to offer clear signals in an uncertain world. Support, resistance, moving averages and trend lines are discussed daily on financial channels. A technical analyst studying the Kospi Index might point to a moving average as a pivot for sentiment, while commentators on the Sensex Index often highlight round-number levels as psychological markers. Used sensibly, such tools can sharpen timing and risk control. Used blindly, they can encourage overtrading and distract from business fundamentals.
The Basic Building Blocks
Technical analysis examines trends in price and volume, not the fundamentals of the business. Its key premise is that market prices incorporate all available information and that psychology tends to lead to similar patterns. A support level is a price range in which demand has been previously observed to materialise, and a resistance level is a price range in which supply has been previously observed to materialise.
Moving Averages
Moving averages help identify a trend, and the fifty-day and two-hundred-day moving averages are popular indicators among traders. A price closing above the two-hundred-day average is generally considered to be a good sign, and crossing above the fifty-day average on increased volume is viewed favourably by many traders.
Momentum and Volatility Indicators
The relative strength index is a momentum oscillator that measures whether an asset is overbought or oversold. Values above seventy usually suggest overbought conditions, and values below thirty usually suggest oversold conditions, but these observations often do not hold in strong trends where prices move higher or lower for extended periods of time and should be taken with a pinch of salt.
Other momentum indicators include the moving average convergence divergence and Bollinger bands, which measure the standard deviation around a moving average. One or two indicators are often enough to evaluate momentum; using several different indicators at once can lead to conflicting conclusions.
Where Technical Tools Help Long-Term Investors
Many long-term investors find technical analysis useful as a tool to estimate when to get in or out of a position or to scale into a position if support levels are holding. Setting stop-loss orders based on price levels also help prevent precipitous losses if one’s hypothesis about a stock proves to be incorrect.
In addition, charting can help highlight crowded trades, such as a stock that has rallied hundreds of per cent, which could see a sharp correction even if fundamentals remain intact. Having an awareness of such possibilities encourages appropriate position sizing.
The Limits of Chart Reading
There is subjectivity in chart reading, and different chartists will come to different conclusions. Chart patterns are often spurious, and any given signal has a fifty per cent chance of being correct or incorrect. Furthermore, patterns do not always repeat, so a price behaviour that has previously occurred may not necessarily occur again. Lastly, fundamentals, news, regulations or liquidity developments can invalidate any technical pattern almost immediately.
The danger of hindsight bias is especially acute in technical analysis, and any given method has a poor likelihood of success if evaluated using historical data. It is important to apply a test method to each approach and to accept how frequently one wins or loses and how much one wins or loses on average. A method that wins sixty per cent of the time but loses twice as much as it gains on average would actually be a losing strategy.
Combining Charts With Fundamentals
A fundamental approach should be used in tandem with technical analysis. The former helps separate good businesses from bad ones, while the latter helps time the entry and manage risk. If a fundamentally sound company breaks below a key support level on large volume, it might be worth investigating further to determine whether there has been a fundamental change in the business.
It is also important to have a written investment plan that states the reasons for taking a trade and the time horizons in which one will buy, sell or hold. Furthermore, one should adhere to it and update it only at predetermined times instead of continuously adjusting it throughout the trading day.
Above all, it is essential to remember the long-term purpose of investing, and in particular to save money for retirement or another specific goal decades from now. Chart analysis should be used to fine-tune trades and set stop-loss orders but should not become an obsession. Technical analysis is a helpful assistant but not a market oracle.
